ASTM E2737 Five Groove Wedge
16.11.2019, 01:41
In E2737 (Practice for Digital Detector Array Performance Evaluation and Long-Term Stability) two Tools are recommended to do the tests, the five groove wedge and the duplex plate phantom.
The five groove wedge itself is established in two different materials: Stainless steel or Aluminum:
The idea behind the gooved wedge is a wedge where a wire set (ASTM E747 or ISO19232-1) would be on one side of the wedge that the user could see which wire is visible at which material thickness. As the flaws are mainly missing material (and not inclusions) the additional absorption of the wire is in the wrong direction and - additionally - often the wires have a different absorption compared to the base material. Removing material from the wedge solve theses issues with the result that the user could see which size of missing material he could see at which material thickness with one tool only.
Like the wire sets, this tool measures contrast and spatial resolution at the same time - a higher contrast sensitivity could compensate lower spatial resolution. Finally the user wants to get an indication what he could see with his systems. And: E2737 is not a system qualification - this is E2698. The intention is to measure the base performance and then on a regular bases the degradation of the system. Using the five groove wedge it could be done very fast.
The size of both wedges are good for systems with 225kV but not limited to.
The first version is the Aluminum version:
the second one the stainless Steel verion:
Users with CT system could also use the wedges to track the performance of their CT system. As CT system require to penetrate all areas of the IQI, higher energies are recommended - but normally standard with CT systems.
Last edited by admi on 17.03.2020, 22:18, edited 3 times in total.
Reason: Included picture of wedges
Reason: Included picture of wedges
Re: ASTM E2737 Five Groove Wedge
16.11.2019, 02:16
The specification of the grooves is quite tuff. When the manufacturor of the first two wedges, which were used for qualification of the IQI, went out of business, I was faced with the problem that the second source manufacturer did not meet the tolerances.
In 2014 I got both wedges (Al and SS) and measured the size of the grooves with different tools - standard optical system (macro lens on a DSLR), a optical microscope with µm scale, a µ-focus system with a wire set as reference and second with a duplex wire set for size calibration, and finally with a high resolution DDA system.
Here are the results of the steel version - the normative sizes of the five grooves are at the left columns:
First you can observe that the two smallest grooves (127µm and 250µm) are much larger than required. Second you see, that the measurement methods are not consistent - the optical systems show the largest sizes.
The deviation of both wedges to the standard are shown in the next table:
or another graph:
The deviation for the 127µm grooves is about 100% - which would be in real a 254µm groove
As there was no manufacturer who could do the wedges for reasonable costs, we tested what minimum size and shape would be possible. Additionally some users complained that the groove size spread to much and asked for smaller steps (with the wire sets there are three wires for double size). As beeing the PoC at that time I came up with the following proposal for new size of the grooves:
And presented a manufacturer who could do both wedges with the required tolerances of 50µm in size and shape:
Due to some issues with the general procedure of the contrast to noise measurement this standard got always Negatives in the ballots from 2015 up to end of the year 2017. As a standard would be dropped from the list of active standards after 7 years without succesful reapprovement, in the last ballot (December 2017) the standard E2737 was submitted for reapproval with no change; the successful completion of this action ensured the standards continued publication - but still with the "old" sizes of the grooves (and non of the other improvements which were already agreed in the committee).
Today the users of the five groove wedges are faced with the problem that they will not get a wedge made to the tolerances of the standard. The only two grooves which are on both wedges in same size are the 400µm and the 800µm grooves (which - of course - could be used for the E2737 procedure).
A second issue came up when the high contrast/low noise systems enter the market: The material structure of the Aluminium 6061 has a lot of internal structures which avoid a proper evaluation. Switching to a material with very low internal structures like AL7022 could solve this problem helping the user to do a more easy performance tracking.
Re: ASTM E2737 Five Groove Wedge
13.12.2019, 09:42
Some example of the material effect that Klaus mentioned:
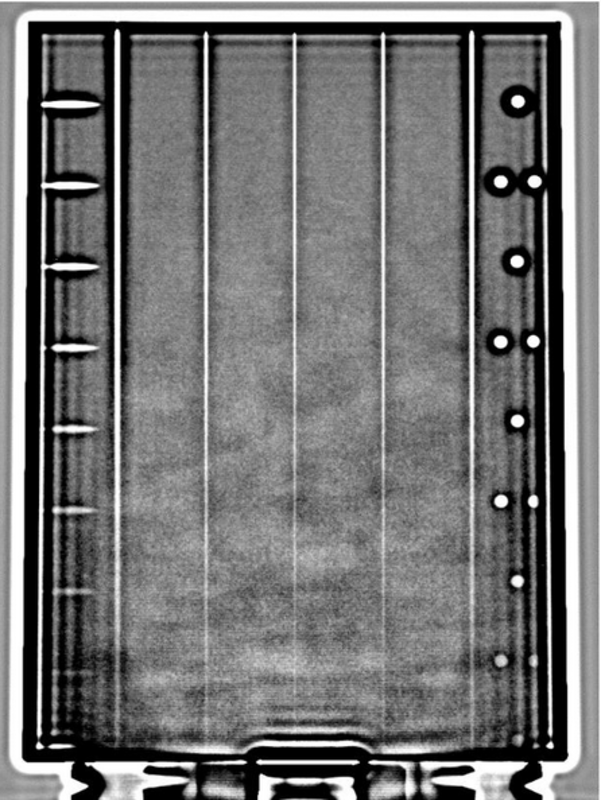
This image was taken with the steel version of the wedge and an Yxlon minifocus tube with 160kV at 6.5mA and a 0.5mm Cu filter. The detector is a Varex 4343 DXi with DRZ+ scintillator and 60 seconds integration time at 1x1 resolution with 4pF. Even with the great image enhancement, the center line is difficult to trace.
This image was taken with the steel version of the wedge and an Yxlon minifocus tube with 160kV at 6.5mA and a 0.5mm Cu filter. The detector is a Varex 4343 DXi with DRZ+ scintillator and 60 seconds integration time at 1x1 resolution with 4pF. Even with the great image enhancement, the center line is difficult to trace.
Re: ASTM E2737 Five Groove Wedge
09.08.2021, 10:40
I have a question about five groove wedge. As we realize that the "five groove" is using for IQI parameters test, there is another structures on the plane of five groove, however I couldn't find any description about using these structures for IQI testing. So What are these structures designed to do ?
Re: ASTM E2737 Five Groove Wedge
09.08.2021, 13:53
Colin,
as far as I know the five groove wedge is intended only for usage in Digital Detector Array Performance Evaluation and Long-Term Stability Tests which are descriped in ASTM E2737.
What do you mean with "IQI-Testing"?
And what kind of structures do you mean?
as far as I know the five groove wedge is intended only for usage in Digital Detector Array Performance Evaluation and Long-Term Stability Tests which are descriped in ASTM E2737.
What do you mean with "IQI-Testing"?
And what kind of structures do you mean?
Re: ASTM E2737 Five Groove Wedge
10.08.2021, 07:29
Klaus wrote:Colin,
as far as I know the five groove wedge is intended only for usage in Digital Detector Array Performance Evaluation and Long-Term Stability Tests which are descriped in ASTM E2737.
What do you mean with "IQI-Testing"?
And what kind of structures do you mean?
sorry, my mistake, I mean DDA performance evaluation and long-term stability test.
second ,see the image(from E2737 FIG. X1.2).
Re: ASTM E2737 Five Groove Wedge
10.08.2021, 09:30
 Sorry, that ist funny
 This marks are indicators that should help you to see where you are with the line profile if you are moving the line from the thinnest thickness to the larger thickness (see 9.3.1.2 and FIG. 3 Moving the Line Profile on the Wedge from Thin to Thicker Material in E2737, page 9).
The usage of the 5 groove wedge is to see, where the line you are looking for disappears in the noise. Then you should look at the indication on the side and by the marks you could see it in [mm] or ["]. The [mm] indicator come with single and double dots - this should help the reading.

Re: ASTM E2737 Five Groove Wedge
10.08.2021, 09:46
I just found in a temporary version (which was on ballot, but not released) a more clear indication about the marks on both sides and the thickness there:
E.g., if your lineprofile would let you stop at the position which is shown in the image above, you would be at 43mm thickness (right marks) or 1.7" thickness (left marks).
E.g., if your lineprofile would let you stop at the position which is shown in the image above, you would be at 43mm thickness (right marks) or 1.7" thickness (left marks).
Re: ASTM E2737 Five Groove Wedge
11.08.2021, 04:21
Klaus wrote:I just found in a temporary version (which was on ballot, but not released) a more clear indication about the marks on both sides and the thickness there:
E.g., if your lineprofile would let you stop at the position which is shown in the image above, you would be at 43mm thickness (right marks) or 1.7" thickness (left marks).
Appreciate

 !, further question: is that 43mm an estimate or is there another way to accurate the thickness to 1mm?
Actually, I have another question about E2737.
In 9.3.4 Signal to Noise Ratio, it says that SNR is the quotient of the mean gray value and the median single line standard deviation(noise),
in FIG. 4 Measure the Mean Grey Value(Signal Level) and Median Single Line Standard Deviation(Sigma), there is an ROI size of 67*48,
I have some confusion about understanding the notion of "median single line", does that mean that the line is IN the middle of the ROI(i.e. , in that case, the 24th line, or the 25th line, or the mean gray of them)?
It seems that , in E2737, the software for measuring the images is Isee, however I was told that, in the version of 2019, the function about measuring "median single line mean" has been removed,
in fact, I haven't seen the same function in other DR image measuring software.
It confuse me for a while.
thanks for your reply again!
Re: ASTM E2737 Five Groove Wedge
11.08.2021, 08:02
Klaus wrote:I just found in a temporary version (which was on ballot, but not released) a more clear indication about the marks on both sides and the thickness there:
E.g., if your lineprofile would let you stop at the position which is shown in the image above, you would be at 43mm thickness (right marks) or 1.7" thickness (left marks).
(somehow it shows submit successfully, but actually failed, so I have to retype again
 )
)Thanks for your reply! further question:
is that 43mm estimated or there is an another way to precise the thickness to 1mm?
Actually I have another question about E2737.
In 9.3.4 Signal to Noise Ratio, it says that SNR is the quotient of the mean gray value and the median single line standard deviation(noise),
and in FIG. 4 Measure the Mean Grey Value(Signal Level) and Median Single Line Standard Deviation(Sigma), there is an ROI size of 67*48,
I have some confusion about understanding the notion of "median single line", does that mean that the line is IN the middle of the ROI(i.e. , in this case, the 24th line, or the 25th line, or the mean gray of them)?
It seems that , in E2737, the software for measuring the images is Isee, however I was told that, in the version of 2019, the function about measuring "median single line mean" has been removed,
in fact, I haven't seen the same function in other DR image measuring software.
it confus me for a while.
thanks for your reply again!
Re: ASTM E2737 Five Groove Wedge
12.08.2021, 10:22
Klaus wrote:I just found in a temporary version (which was on ballot, but not released) a more clear indication about the marks on both sides and the thickness there:
E.g., if your lineprofile would let you stop at the position which is shown in the image above, you would be at 43mm thickness (right marks) or 1.7" thickness (left marks).
Thanks for your detailed answers, and is 43 an estimate or is there another way to accurate thickness to 1mm?
Actually I have another question about E2737.
In 9.3.4 Signal to Noise Ratio, it says that SNR is the quotient of the mean gray value and the median single line standard deviation(noise),
and in FIG. 4 Measure the Mean Grey Value(Signal Level) and Median Single Line Standard Deviation(Sigma),
there is an ROI size of 67*48, I have some confusion about understanding the notion of "median single line", does that mean that the line is IN the middle of the ROI(i.e. , in this case, the 24th line, or the 25th line, or the mean gray of them)?
It seems that , in E2737, the software for measuring the images is Isee, however I was told that, in the version of 2019, the function about measuring "median single line mean" has been removed,
in fact, I haven't seen the same function in other DR image measuring software.
it confus me for a while.
Thanks for your reply again!
Re: ASTM E2737 Five Groove Wedge
17.08.2021, 07:27
Klaus wrote:I just found in a temporary version (which was on ballot, but not released) a more clear indication about the marks on both sides and the thickness there:
E.g., if your lineprofile would let you stop at the position which is shown in the image above, you would be at 43mm thickness (right marks) or 1.7" thickness (left marks).
Thansk for your reply!
Actually I have another question about E2737.
In 9.3.4 Signal to Noise Ratio, it says that SNR is the quotient of the mean gray value and the median single line standard deviation(noise),
and in FIG. 4 Measure the Mean Grey Value(Signal Level) and Median Single Line Standard Deviation(Sigma), there is an ROI size of 67*48,
I have some confusion about understanding the notion of "median single line", does that mean that the line is IN the middle of the ROI(i.e. , in this case, the 24th line, or the 25th line, or the mean gray of them)?
It seems that , in E2737, the software for measuring the images is Isee, however I was told that, in the version of 2019, the function about measuring "median single line mean" has been removed,
in fact, I haven't seen the same function in other DR image measuring software.
it confus me for a while......
Re: ASTM E2737 Five Groove Wedge
30.08.2021, 16:11
thanks.
I have two more quetions:
1. In 9.3.4, the SNR is measured in area with changing thickness(Fig.4), thus the noise is "the median single line standard deviation", the question is that the noise value is difficult to measure by using software, is there other way to measure it?
2.In 8.2.5.3,it mentioned that “a sequence of images shall then be captured for about 20s while shutting down the X-rays after approximately three seconds” , and in 9.5.1, it says "A ROI of about 50 by 10 pixels shall be drawn in the area where the signal level is about 85% of the signal level in image L Img 1 for the same ROI......The next image in the sequence [L Img S1] shall be taken and the same ROI shall be drawn at the same position in that image(9.5.1.2)".
Well, for our DDA system , we can barely capture images that " the signal level is about 85% of the signal level in image L Img 1" , even capture images immediately while shutting down the X-rays instead of "after approximately three seconds (8.2.5.3)", the gray value is too low and far from that, therefore the image lag can not be measured successfully.
I really have no idea who to ask for help......
Re: ASTM E2737 Five Groove Wedge
30.08.2021, 18:25
Colin Gan wrote:Actually I have another question about E2737.
In 9.3.4 Signal to Noise Ratio, it says that SNR is the quotient of the mean gray value and the median single line standard deviation(noise),
and in FIG. 4 Measure the Mean Grey Value(Signal Level) and Median Single Line Standard Deviation(Sigma), there is an ROI size of 67*48,
I have some confusion about understanding the notion of "median single line", does that mean that the line is IN the middle of the ROI(i.e. , in this case, the 24th line, or the 25th line, or the mean gray of them)?
It seems that , in E2737, the software for measuring the images is Isee, however I was told that, in the version of 2019, the function about measuring "median single line mean" has been removed,
in fact, I haven't seen the same function in other DR image measuring software.
it confus me for a while......
The median single line sigma is the sigma of the line, which sigma value is the median sigma value of all lines. It is similar to a median filter in image processing. The procedure is first described in ASTM E2446-16_Practice_for_Classification_of_Computed_Radiology_Systems in 6.1.1.8.
There is another image measuring software, which has this function build in: Image 3500 from YXLON. And - as far as I know - also the GE and Visiconsult Softwares should be able to do this function.
Which Softwares did you look for and missed it?
Re: ASTM E2737 Five Groove Wedge
30.08.2021, 18:36
Colin Gan wrote:thanks.
I have two more quetions:
1. In 9.3.4, the SNR is measured in area with changing thickness(Fig.4), thus the noise is "the median single line standard deviation", the question is that the noise value is difficult to measure by using software, is there other way to measure it?
2.In 8.2.5.3,it mentioned that “a sequence of images shall then be captured for about 20s while shutting down the X-rays after approximately three seconds” , and in 9.5.1, it says "A ROI of about 50 by 10 pixels shall be drawn in the area where the signal level is about 85% of the signal level in image L Img 1 for the same ROI......The next image in the sequence [L Img S1] shall be taken and the same ROI shall be drawn at the same position in that image(9.5.1.2)".
Well, for our DDA system , we can barely capture images that " the signal level is about 85% of the signal level in image L Img 1" , even capture images immediately while shutting down the X-rays instead of "after approximately three seconds (8.2.5.3)", the gray value is too low and far from that, therefore the image lag can not be measured successfully.
I really have no idea who to ask for help......
1. As far as I know the noise could only be measured by software as it is a mathematical function. Here the median line value is required as you have a gradient on the columns which will spoil the SNR value.
2. Normally a detector will be read out sequencly - the first pixel is read out just after the very last pixel - as the DDAs normally have no shutter. When you shut down the tube there will be an image where the brightness is reduce a bit - mainly in a part of the image.
If you capture a sequence of images you will have one image with this condition. Take this image as start image for measurement and there the area where the signal is dropped to about 85%.
Actually E2737 is back from sub-ballot and in the version in ballot the lag measurement is removed from this standard. It will stay in E2597 only. If E2737 also passes the main ballot it will have no lag measurement anymore ...
Re: ASTM E2737 Five Groove Wedge
30.08.2021, 18:42
Colin Gan wrote:(somehow it shows submit successfully, but actually failed, so I have to retype again
The forum software seems to see you post as SPAM, because your post needed to be approved for some reasons (which I do not know ).
Sorry for this
Re: ASTM E2737 Five Groove Wedge
31.08.2021, 15:40
Which Softwares did you look for and missed it?
We are now using ISee! Professional 2017 (we are asking update....for CNR measuring). The software can just give us a mean gray value for a given ROI, and seems unable to give the "median sigma value of all lines". Our manufacturer supplied us with another software, which could not do it either....
If you capture a sequence of images you will have one image with this condition
Tell me if I am wrong, in the process of image-lag measurement, we set the capture speed of 1frame/s, thus one image per second, during the 20s after shutting down the X-ray, we have a number of images. However, the gray value seems to drop too fast to be about 85%, in fact, we can barely see the lag in the first image.
The same question occurred in measuring Burn-in, according to 9.5.2, we measured the Burn-in (BI img 1)=0.37%, but we can hardly see the phantom in BI Img10.
So, is it possible that gray value drop too fast result in unsatisfied image?
or we did it wrong?
Re: ASTM E2737 Five Groove Wedge
02.09.2021, 11:07
The ISee Software is used to do the tests for the CR qualification (ASTM E2446) - therefore I am quite sure you could also do the median line SNR. Uwe Zscherpel guided the design of this software, you could send a PN to him and ask your question directly "at the source".
The lag measurement asumes that you are using the highest frame rate of the detector. Then you will see the 85% of the signal. If the readout time of the detector is small compared to [exposure time - readout time] you may have difficulties to get the frame with the 85%, because the drop down of the intensity of the tube will probably be in a time where you do not read out the detector.
The Burn In test makes only sense if you are using a scintillator which is sensitive to burn in (like CsI). If you are using GADOX you will not see a burn in. Please refer to ASTM E2736 for details about the scintillator.
Re: ASTM E2737 Five Groove Wedge
02.09.2021, 23:06
I just startet my ISee version and I found the way to get what you are looking for:
A) select the statistic box (5)
B) in the lower area you will find the median single line mean value and the median single line standard deviation (this is the median sigma value of all lines in the box):
and in the next line the quotient of both - the median single line SNR.
A) select the statistic box (5)
B) in the lower area you will find the median single line mean value and the median single line standard deviation (this is the median sigma value of all lines in the box):
and in the next line the quotient of both - the median single line SNR.
Re: ASTM E2737 Five Groove Wedge
05.05.2022, 10:05
Hi Klaus:
Why do you design the finest grooves as 0.127mm instead of,like 0.1mm
Why do you design the finest grooves as 0.127mm instead of,like 0.1mm
Hosted by iphpbb3.com
Impressum | Datenschutz